Measuring Particles in the Air
The concentration of particles in the air we breathe is an important health concern. Environment agencies set standards such as that PM10 (concentration of particles less than 10 µm in diameter), when averaged over 24 hours, should be no more than 50 µg/m3. The methods used here are not capable of such accuracy, being more an indicator of high, medium or low concentrations.
The type of sampling used in these experiments is 'active sampling'. It is active because you use a pump to draw air through a filter. The amount of air pumped through the filter in a given time can be 'low volume' or 'high volume'. A typical sampling period would be 24 hours. A low volume sample using a fish tank pump and methods described here would be less than 5 m3 of air over the 24 hour period. When the concentration of particles is very low we need to take a bigger sample so there is something to measure. Then you must use high volume sampling. A typical sample period might again be 24 hours. A high volume sample using a vacuum cleaner as the 'pump' might be 60 m3. Of course, you might want to take a sample over only a couple of hours and this would work if the concentration of particles is high — this might be the case near an industrial road intersection.
The measurement you make is an estimate of the mass of soot (carbon) in the air. It is done by observing how dark a sample filter becomes and relating this colour to a calibration chart that gives the mass of carbon on the filter. This ‘filter soiling’ approach is very different to that used currently by environment agencies — measuring the change in weight of a collector by modern expensive monitoring equipment.
The Airwatch particle measurement method is similar to the old European 'black smoke' technique. There are current OECD, UK (BS 1747) and Australian (AS 2724.2-1987) standards and guidelines describing the technique. But the 'black smoke' measurement has been largely set aside as better understanding has led to the realisation that any relationship between filter soiling and concentration of fine particles in the air varies according to many uncontrolled factors. Hence the assertion that ultimately, the method here gives no more than an indication of high, medium or low concentrations.
Aims
- To collect aerosol (particle) samples by active sampling methods
- Compare each sample with a 'grey scale' photographic sheet to calculate the concentration of dark particles in the air
- Using knowledge of the general conditions and the measured sample collected, estimate the concentration of particles in the air
- Use the results of this experiment as well as meteorological data, and field observations to discuss the air quality for that time period.
Equipment

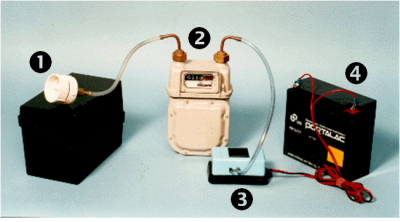
The photo shows the essential components of the setup for low volume sampling. A filter in the filter holder (1) collects the particles. The flow meter (2) measures how much air is sucked through the filter and the fish tank pump (3) sucks the air into the tubing. The battery (4) is necessary for operation away from mains power. If power is available or you use a big battery, you could do high volume sampling using a vacuum cleaner as the pump.
With the recommended filter holder and a fish tank pump that provides a sample of approx. 4 m3 over 24 hours, the inlet to the filter holder acts as a size-selective inlet with a characteristic of a little less than 10 µm diameter. Faster sampling using a vacuum cleaner would decrease the size range of particles collected.
You will also need a Grey Scale sheet to estimate the mass of soot on the sample. Note that you MUST use an original Grey Scale sheet, not a copy. If you need a sheet, send email.
Sampling Strategies
Twenty four hours is a long time to sample, but this length of time may be necessary to obtain sufficient sample in relatively clean Australian urban areas. Longer or shorter sampling times may be necessary in your region.
You might only be interested in the pollution during daytime, not night time, or you want only to make measurements during morning peak traffic times, or while you bicycle to work or you have some other plan where continuous 24 hour sampling would not give the required result.
The way to do this may be to repeatedly sample at the times you want until about 24 hours of sample is obtained. For example for a roadside monitoring strategy this might mean sampling every morning at peak hours from 7am through to 9am (2 hours) for a total of 12 week days only. Then an adequate sample should be obtained. Alternatively try high volume sampling over shorter periods.
Examples of sampling sites suitable for this experiment are:
- a busy road (either alongside a freeway or at a major intersection)
- an industrial site or factory location
- suburban street/residential block
- inside a house which is heated by an open fire
- in a car park (covered, rather than open air).
It might be instructive to make a comparison between a site near a busy road or industrial area and one that is not.
Equipment Setup
In practice the setup depends on your sampling strategy. If sampling near a road or some other area, use a long enough piece of tubing between the filter holder and the flow meter so that the holder can be set up about 1.5 metres above the ground (at the height where you would be breathing). Point the filter holder downwards so that dust does not fall into the inlet and so the wind cannot directly blow into it either. Similar rules should be followed if sampling from a bicycle or car or following some other strategy.
Method
- Clean and dry the filter holder before each sampling period
- Select an appropriate site for sampling
- Set up equipment according to the photo
- Load a filter into the holder, smooth side out. Carefully screw down the cap tightly (to stop air leaks). The 'O' rings must be in place to enable an air-tight seal in the filter holder
- Make sure that the equipment is secure from tampering and protected from the weather
- Record in the 'Table of Results' the flow meter reading at the start time (the meter reads in litres and hundredths of litres)
- Start the pump by connecting the battery or power supply.
- Regularly check the voltage of the battery, and the air flow through the flow meter
- Record the flow meter reading after 24 hours of sampling, or after such other planned sampling time. Record readings in the table
- Carefully remove the filter from the filter holder using tweezers
- Place the filter in a clear plastic envelope
- Label the envelope with date, location, sample time, and the air volume sampled.

Click the Table to see one for you to print from the browser.
Calculations and Results
Step 1
Compare the colour of the filter paper you have collected with the Grey Scale by holding it under the cutout (one of the black filled circles on the Scale sheet) and decide which segment on the Grey Scale most closely matches your sample.
Your sample from the real atmosphere will include other aerosols (such as soil particles) which give the sample a browner colour. In addition the printing process for the Grey Scale produces a matt grey colour; the filter will have a texture that at first sight might be confusing.

Step 2
Record the Grey Scale Number of the matched colour segment. For example, you might decide the best match colour segment is Number 3.
Step 3
Read the Mass of Carbon on the sample from the calibration chart on the Grey Scale sheet. For example, Grey Scale Number 3 gives Mass of Carbon as 14±4 µg.
Step 4
To calculate the average concentration of particles in the air for the sampling time:

The example gives Concentration = 14/3.9
= 3.6 µg/m3 averaged over 24 hours.
Interpretation
How does your sample rate? It is a measurement of soot (or black carbon) concentration. To interpret this reading in terms of air quality standards, you must scale it to be an estimate of general fine particles, not just carbon. There are many other kinds of particles in the air, and these depend on the season, condition of motor vehicles and fuel types, and other things such as use of wood for heating, bushfires, etc.

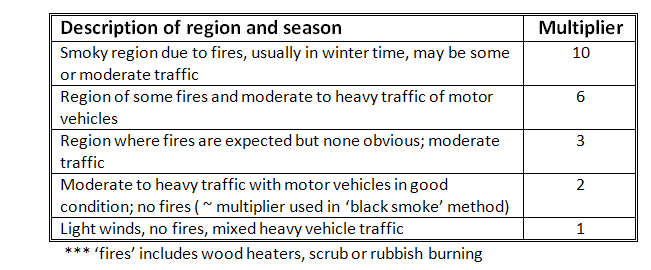
Pick a description from the Table that most closely describes the general region where you made your measurements — the surrounding few kilometres if outdoors, the whole house if indoors.
Now multiply the concentration measured with the Airwatch sampler by the factor from the Table and this is an estimate of the particle concentration we have measured.
For the example, it was a busy neighbourhood with wood heating in the evening. The multiplier is ‘6’ from the Table and the estimate is
Concentration (24 hour average) = 6 x 3.9
= 23 µg/m3.
Compared to the Air NEPPM of 50 µg/m3 averaged over 24 hours for particles less than 10 µm in diameter, you can report that the observed concentration on a scale of 'low', 'medium', 'high' is 'medium' with a large uncertainty due to uncertainty in the multiplier you have used.
Discussion
If more than one site has been sampled, how do the different sites compare?
Can you give any reasons why you think these different sites have different levels of particles?
What effect would the weather conditions be having on these levels?
Would these weather conditions be making air quality better or worse?
Overall, do any of the sites sampled seem to have a particle problem that warrants further investigation?
Reference Material
AirWatch — The CSIRO Kit Peter Manins, Margot Finn and Jennifer Anderton 13th International Clean Air & Environment Conference CASANZ, Adelaide, Australia 22–25 September 1996 pp 61–65.
AirWatch: Does it Measure Particles or What? P.C. Manins, Air Quality and Climate Change vol 46 no. 4 November 2012 pp 17–21.