Solar Power
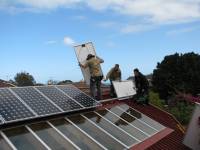
On 31 May 2010 we contracted Energy Matters to install a solar system on the pool room roof. The design capacity is 3240 W. Initially sized at 16 panels to offset the consumption of the swimming pool pump, it was increased by two panels to cover the whole length of the roof.
- Suntech STP180S/24Ad monocrystalline panels (180 Wp, 24 V) x 18
- Fronius IG40 outdoor grid connect inverter, 4100 W capacity
- Sunlock frames and mounting system and all cabling to suit.
The net cost to us was $13,510, including discount, RECs/Solar Credits of $8,351.37.
The job was done on 30 June 2010. The 18 panels cover the full width of the Pool Room. The top of the panels is about 40 cm above the ridge line of the roof, and parallel with the roof at an angle of 28° to the horizontal, orientated approximately 7.5°E of N.
The angle of the panels and the large gap between the roof and the panels make for an ideal installation for a grid-connect system.
Solar System Design
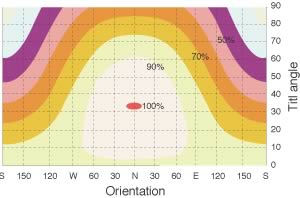
This document has proven its worth for relevance and accuracy. The diagram, from the document, shows the effects orientation from North and tilt angle have on output from a panel located at latitude 35°S (Sydney). Clearly, a wide range of orientations and tilts give very useful output. Our installation is at 38°S with an orientation of 7.5°E and a tilt of 28°.
The panels used are from Suntech, a Chinese company originating in University of New South Wales. The panels are 1580 mm x 808 mm, monocrystaline rated at 180 Wpeak.
Most important is that there be no shadows on the panels due to a chimney, antennae, trees or roofs. This is the case for us except around the winter solstice when the shadow from the peak of a house gable roof in front of the panels just intrudes; other parts of the house roof also give some shade in the early morning and late afternoon then too.
Since ours is a grid-connected system (we export excess power to the grid during the day), according to the reference document the tilt angle should be latitude minus 10° to maximise the amount of energy produced annually. The roof pitch of the pool room where the panels are mounted is 28°. It is ideal.
To keep the panels as cool as possible, they should be well away from the roof to allow air circulation under the panels to occur. This has been achieved here.
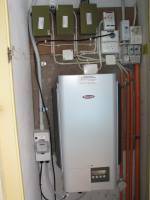
The inverter was installed in a cabinet in the pool room that already contained a sub-board and very heavy single-phase power wiring from the main switchboard. This was originally used to supply power to the pumps, fans and controllers for the pool gas heater setup that we have removed. This location required only short wiring runs from the panels, and is good for the Net Feed-In Tariff arrangements that are in place in Victoria (see information here). Net Feed-In Tariff means that we are paid for the excess electricity we generate during the day. The alternative, available in some other places, is Gross Feed-In Tariff which means we would be paid for all electricity produced, regardless of our consumption. If Gross FIT were available, in our case it would require very expensive rewiring to take advantage of it.
Monitoring
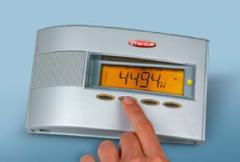 A Fronius
Personal Display is set up in the living room so we can keep an eye on solar system performance. Installation
required opening up the IG40 inverter and adding a wireless transmitter card and antenna. The display unit
receives the signal from this card, showing Watts generated in real time, along with other data such as
current and volts. The menus give access to Wh generated over the past day, year and total.
One item that can be displayed is the peak Watts produced. Due to cloud edge effects, the peak can occasionally be well above the rated panel output, but usually only briefly. After 12 months of operation, maximum observed was 4431 W, 10% over the rated output of the inverter and 37% over the rated output of the panels.
Performance
It is clear from observing the display that system output really is higher on cold days compared to hot days. The output voltage and power of the panels decrease as the temperature of the cells increases. The Suntech nominal operating temperature of PV cells is 45°C, and maximum power decreases 0.48%/°C. Especially in the summer, cell temperatures can typically be anywhere from 30° to 35°C above ambient when the module is exposed to 'full' sunlight. So, if the cell temperature is 35°C above a 30°C ambient, cell temperature will be 20°C above the specified 45°C, and the effect on maximum power output could be 20°C x 0.48%/°C = 9.6% loss in power.
Of course, the opposite is true on a cold day. It's quite possible that we can have days when the panels are operating at 5°C and we should see 40°C x 0.48%/°C = 19% power increase. This and the cloud edge effects mentioned earlier, are good reasons to have an inverter that is rated above the peak panel output. The IG40 can accept up to 5500 Wp and can generate a maximum of about 4100 W. It's not clear what that peak output reading of 4431 W means in practice.
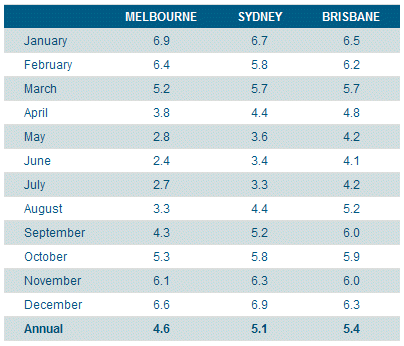
This table shows the expected monthly and annual peak sunhours (kWh/m2) for various locations in Australia.
For Melbourne, the minimum peak sunhours are expected to occur in June, averaging 2.4 kWh/m2, rising to a maximum in January averaging 6.9 kWh/m2.
The expected annual average is 4.6 kWh/m2, only 10% lower than for Sydney.
Shown here are kWh data for the 12 months July 2010 to June 2011: the electricity imported from the grid, generated by the solar system, net electricity exported to the grid, and other performance figures. The solar system efficiency has been set to 87%, made up of the efficiency of the Fronius inverter (94.3%) and various other efficiencies, including tilt and orientation of the panels. This overall efficiency figure gives an expected full year generation equal to the actual 12-month solar electricity generated. The figure may need to be revised with further experience.
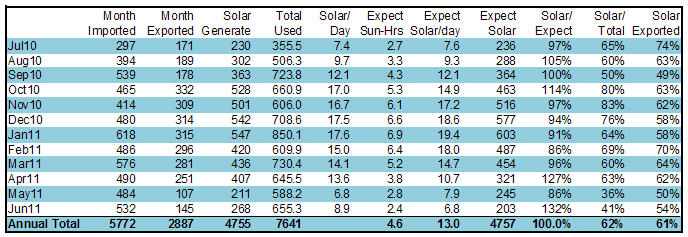
The house imports approximately twice the energy we export to the grid. Our long-term objective is to reduce this ratio as much as possible.
June 2011 stands out with solar electricity generated being 132% of the expected amount. We were travelling for some of May and June, and have had to interpolate some figures so the proportions between May and June may not be accurate.
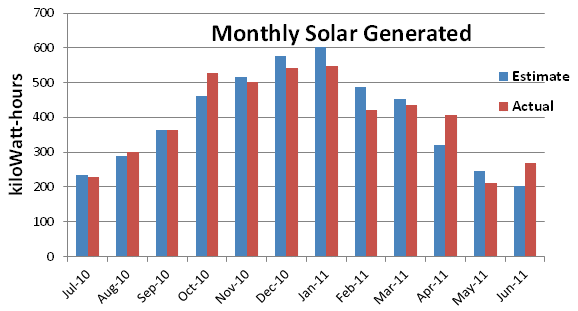
Overall, the solar system generated 4755 kWh of electricity, and 61% (2887 kWh) of this was exported to the grid. The remaining 39% was consumed on the premises. Solar provided 62% of all electricity consumed.
Standardising the performance, over the twelve months our solar system generated 4.02 kWh/kWp on average. The maximum observed generation occured on 2 November 2010 with a peak of 27 kWh (25 kWh or better has been commonly observed). So the standardised maximum generated was 8.33 kWh/kWp over a day.
Financial Performance
Privatisation has made an incredibly complex and expensive mess of energy suppy and charges. We are with Origin Energy in Victoria and they pay 66c for every kWh we export to the grid (The [now closed] Premium Feed-In Tariff for Victoria of 60c/kWh [ends 2024] + 6c/kWh from Origin).
We are in the distribution zone of United Energy, and a consequence of installing the solar system was that the grid electricity meter was changed and we were moved to a Time-of-Use tariff for electricity we consume from the grid. The current rates charged by Origin are based on those published in the Victorian Government Gazette. The peak rate is presently (July 2011) 31.603c/kWh and off-peak rate is 11.979c/kWh. Peak period is 7am to 11pm Monday to Friday).
The electricity bills seem to be designed to make it as hard at possible to check against the house meter (in fact it is impossible since the bills do not list ANY meter readings, just consumption figures).
The solar electricity exported over 2010–2011 was worth 2887kWh x 66c = $1,905. To estimate the value of the solar electricity consumed, assume it is the same on weekends as weekdays (we are retired from work). Then a reasonable average rate is Peak*5/7 + Off-Peak*2/7 = 26c/kWh. So (4755 - 2887)kWh x 26c = $486, giving a total value of $2,391 for the 12 months. The payback period is around 5.6 years.
However, there are other important factors. The time-of-use tariff encourages shifting of heavy consumers to night-time hours as much as possible, just as the supplier wants. So the dishwasher and swimming pool pump are set to run from mid-night.
Overall electricity consumption is also influenced, with use of LED bulbs for lighting where practicable, and the installation of a very efficient split-cycle air conditioning plant in the main bedroom. This latter means that we will rarely have to operate the very inefficient whole-of-floor air conditioner that came with the house; it also operates as a very efficient bedroom heater on particularly chilly nights.
Performance Over Time
A big effort continues to improve the passive and active performance of the house. Increased insulation in some ceilings and walls, a replacement program for the leaky single-glaze windows, a lower energy pool pump, and a light replacement program are major activities.
With four years of solar electricity usage now available, we can see whether the efforts are paying off.

The Table shows some successes:
- Solar generated in 2013–14 was 5% lower than expected, while the previous year it was 3% higher.
- The percentage of solar energy generated that was actually exported increased from 61% in 2010–11 to 67% in 2013–14 — it would have been even higher if the weather had cooperated. This improvement shows success in conserving energy during daylight hours.
- A much more sensitive statistic for overall energy performance is the percentage of solar energy exported compared with the total electricity used in the house. It has increased from 38% in 2010–11 to 64% in 2013–14. That is, the energy used in the house has decreased markedly, in fact down from 7641 kWh in 2010–11 to 4774 kWh in 2013–14.
- Another is the ratio of solar energy generated to total electricity used. It has increased from 62% in 2010–11 to 97% in 2013–14!
We have achieved approximately a 50% improvement in energy performance of the house over the four years. This has occurred while at the same time the return on investment has been about $2,300 each year, despite substantial increases in electricity supply and consumption charges.
LINKS
- YourHome http://www.yourhome.gov.au
- Clean Energy Council solar PV Guide http://www.cleanenergycouncil.org.au
- EnergyMatters http://www.energymatters.com.au/
Solar Power
Pool room roof before new glass and solar panels installed.
Installing the solar panels on the poolroom roof - almost finished.
Pool room roof after new glass and all solar panels.
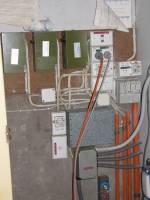
Poolroom switchboard as it was upon us taking ownership. Green boxes are pool light transformers, below are heater control gear.
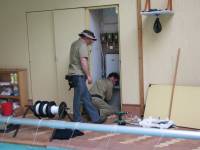
Installing the grid-connect inverter at the poolroom switchboard
The grid-connect inverter and modified poolroom switchboard

